Head-to-head: Root v Williamson


Joe Root and Kane Williamson lit up the first two days of the 2017 ICC Champions Trophy and now they are set to go head-to-head in Tuesday’s Group A encounter.
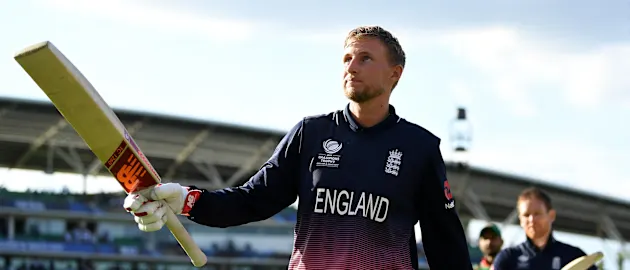
Root hit a career-best 133 not out in a comfortable eight-wicket win over Bangladesh at The Oval – his 10th ODI century – while Williamson scored 100 from 97 balls – his ninth in the format – in New Zealand’s clash with Australia before rain brought an early halt to proceedings at Edgbaston.
Root has a superb record against the Black Caps – averaging 61.20 from 13 ODIs with two centuries – and Williamson’s stats versus England are similarly impressive – averaging 55 with one century from the same number of matches.
Born within four months of each other, and with comparable records across all three formats, there are obvious similarities between Root and Williamson, who are ranked fifth and ninth respectively in the ICC ODI Batting Rankings.
Each like to take their time getting in and rarely play big shots early in their innings, preferring to keep the scoreboard ticking over with singles and hard-run twos and threes. Between overs 1-10, Root’s strike-rate is 69.2 and it steadily builds to 85.6 between overs 11-40 before peaking at 125.4 in the last 10 overs of an innings. Williamson’s strike-rate by phase of innings is very similar: 64.7 in the first 10 overs, rising to 88 in the middle section and then reaching 126.8 at the death.
|
Strike-rate by phase of innings |
||
|
Phase |
Root |
Williamson |
|
Overs 1-10 |
69.2 |
64.7 |
|
Overs 11-40 |
85.6 |
88.0 |
|
Overs 41-50 |
125.4 |
126.8 |
MATCH HERO: Kane Williamson
They like to score their runs in similar areas, too. Root scores 56.9 per cent of his runs on the leg-side, compared to 43.1 on the off-side. Williamson’s scoring map is near enough identical, with the Kiwi skipper scoring 57 per cent of his runs on the leg-side, and 43 on the off-side.
|
Area where runs are scored, by percentage |
||
|
Location |
Root |
Williamson |
|
Off-side |
43.1 |
43.0 |
|
On-side |
56.9 |
57.0 |
There is also little difference between the percentage of dot balls each face – 47.80 for Root, 52.52 for Williamson – or the percentage of deliveries they score boundaries from – 7.19 for Root, 8.65 for Williamson.
|
Dot % / Boundary % |
||
|
Root |
Williamson |
|
|
Dot % |
47.80 |
52.52 |
|
Boundary % |
7.19 |
8.65 |
They do have their points of difference though, in particular when assessing the types of bowlers they favour facing. Williamson shows little preference for one type of bowling over another, averaging 46.90 against seam and 49.70 against spin. He averages in the mid-to-high 40s against all variations of seam and spin, with the exception of left-arm orthodox spin, against which his average rises to 64.66. It’s worth noting that England does not have a left-arm spinner in its squad.
CENTURY: Joe Root dazzles with an unbeaten 133
Root’s breakdown is a less even spread and should give the Black Caps some food for thought as they set plans to counter him. Root’s average of 44.28 against seam is impressive enough, but his average against spin of 68.50 sets him apart.
Against off-spin Root is imperious, averaging 92.37, and against leg-spin he is borderline invincible, boasting a mammoth average of 117.66. However, New Zealand can take some heart from the fact that his average drops to 37.72 against left-arm orthodox spin, so don’t be surprised to see Williamson throw Mitchell Santner the ball early in Root’s innings. Similarly Root’s average of 39.90 against left-arm pace, compared to 45.55 against right-arm pace, will give Trent Boult some encouragement.
|
Average by bowler type |
||
|
Bowler |
Root |
Williamson |
|
right pace |
45.55 |
48.02 |
|
left orthodox |
37.72 |
64.66 |
|
off break |
92.37 |
45.42 |
|
left pace |
39.90 |
43.00 |
|
leg break |
117.66 |
45.76 |
|
Overall |
49.68 |
46.46 |
Two masters of modern batting taking each other on in a world tournament is a tantalising prospect. Who comes out on top could well determine the outcome of the match.
All statistics provided by CricViz, ICC’s official broadcast analytics supplier


